
Hi, I'm Donnoban Maldonado
Research Assistant | Data Science & Analytics
About Me
I'm a recent Computer Science grad who specializes in turning chaos into clarity. Whether it's mining 20,000+ Reddit posts or engineering NLP and ETL pipelines in the cloud, I dig into unstructured data to surface insights that actually matter. I've presented my work at a research conference and earned certifications in Power BI, AWS, and data science. I'm currently a Research Assistant at the SUNY Research Foundation, where I'm using large language models (LLMs) for topic modeling to support the development of an AI-driven counseling tool.
My Projects
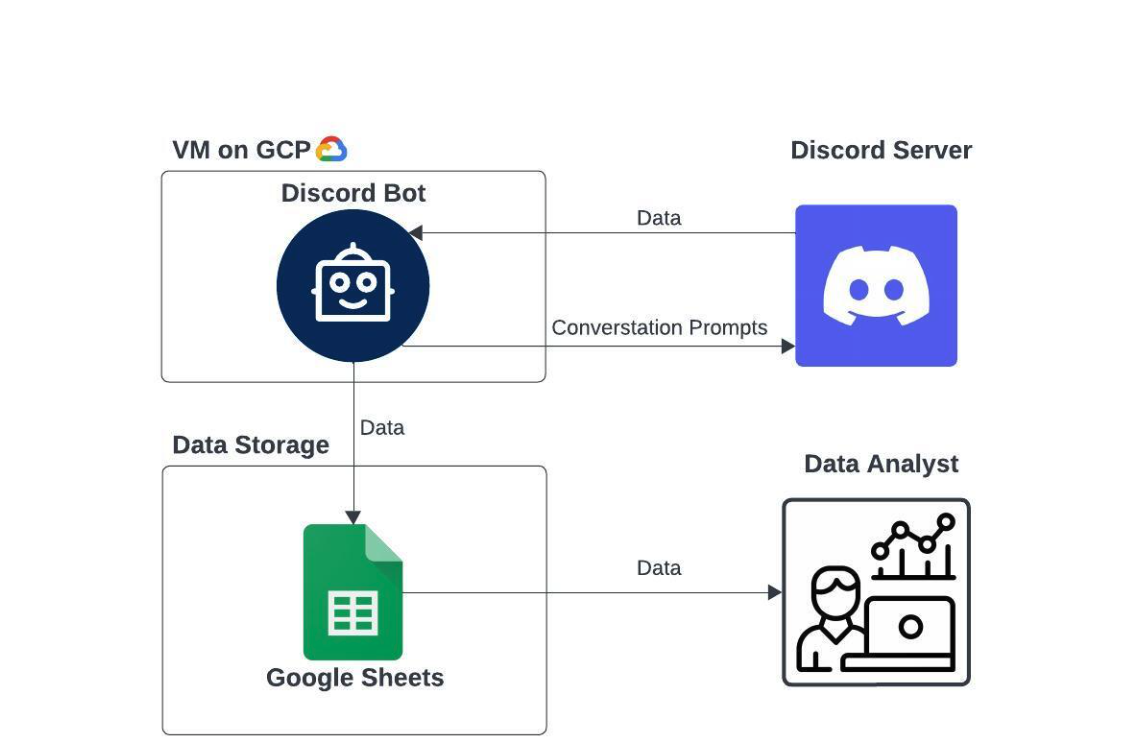
Discord Bot for Data Collection
This project delivers a Python-based Discord bot designed to support and study transfer students in computing fields. The bot builds peer networks while collecting anonymized data to inform AI-driven advising and institutional support systems. Hosted on Google Cloud and using the Google Sheets API for storage, it verifies users via university email, assigns roles, and logs engagement data while maintaining strict privacy standards. Features include moderator tools, inactivity prompts, advisor-only channels, and hashed user identifiers to protect participant identities. Full setup instructions and source code are available on GitHub.

Sentiment Analysis
This project uses sentiment analysis to classify IMDb movie reviews as positive or negative, leveraging Natural Language Processing (NLP) and machine learning. After cleaning and vectorizing the text using Word2Vec (Skip-gram), multiple classification models were trained and evaluated. The Multi-Layer Perceptron (MLP) achieved the best performance, with an F1-score of 0.8911 using a two-layer architecture and 500-dimensional embeddings. This analysis helps demonstrate how sentiment modeling can support entertainment industry insights by gauging audience reactions at scale.
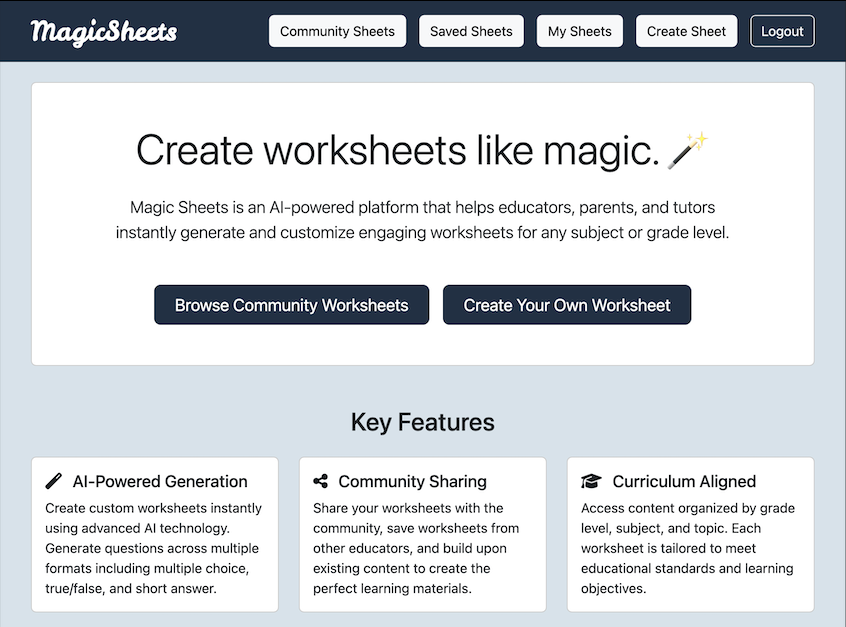
Magic Sheets
MagicSheets is a generative AI-powered web app that enables educators, parents, and students to create customizable K–12 worksheets in seconds. Users can select a subject, grade, topic, and worksheet type (e.g., multiple choice, short answer) and refine output using smart regeneration prompts like "simplify" or "make it more descriptive." Built with Django and powered by OpenAI's GPT-4o, the platform also supports in-browser DOCX editing, curriculum-aligned organization, answer key toggling, and a community-driven ecosystem for sharing and remixing worksheets. The app is fully open source and available on GitHub, with setup instructions and deployment-ready code.
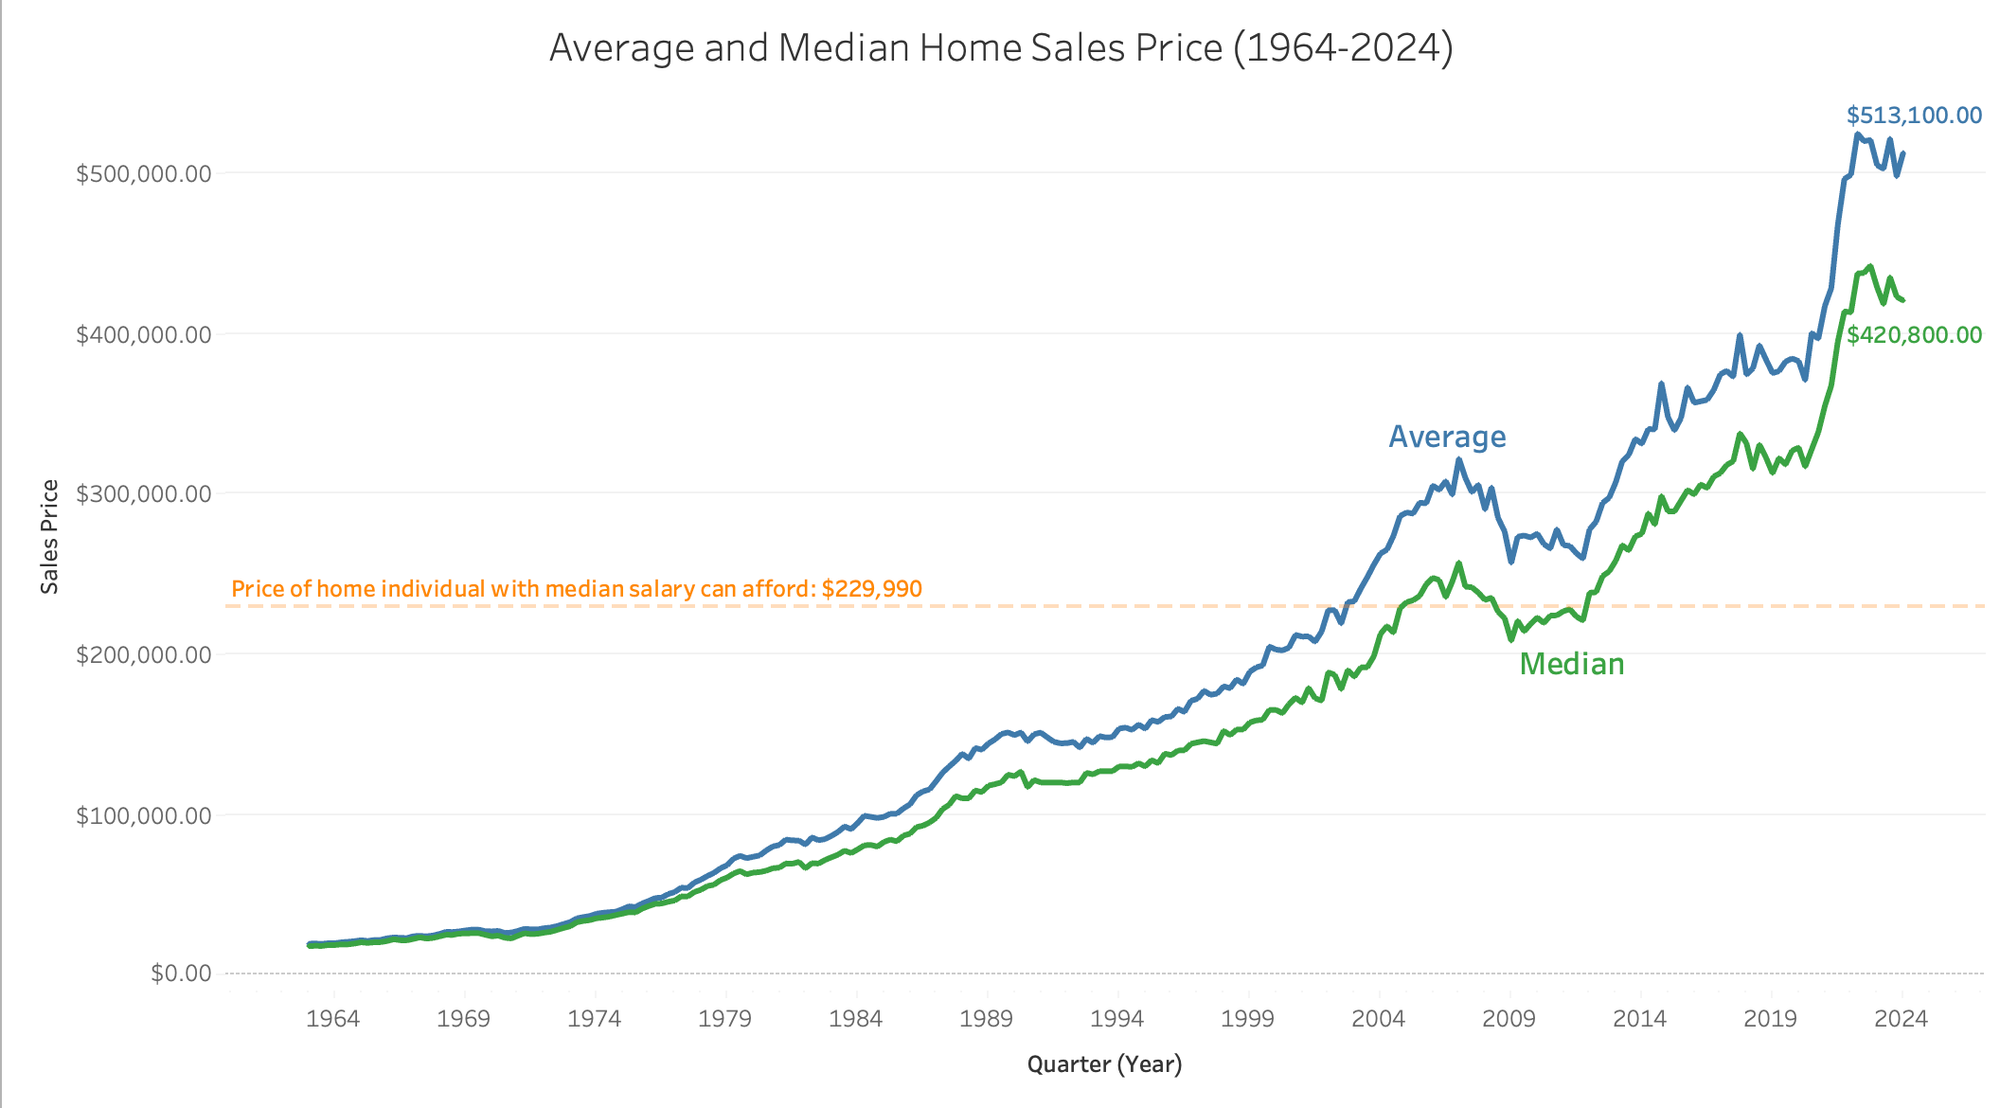
Housing Trends Analysis
This project analyzes U.S. home sales price trends from 1964 to 2024 using data from the Federal Reserve Bank of St. Louis. After cleaning and merging the average and median sales price datasets with Pandas, the data was exported to a CSV file and visualized in Tableau. The dashboard reveals a widening gap between average and median prices, suggesting that higher-priced homes are appreciating faster. Based on a reported median income of approximately $60,000, many individuals can only afford homes priced around $230,000. The last time the median home price was below $250,000 was in 2012.
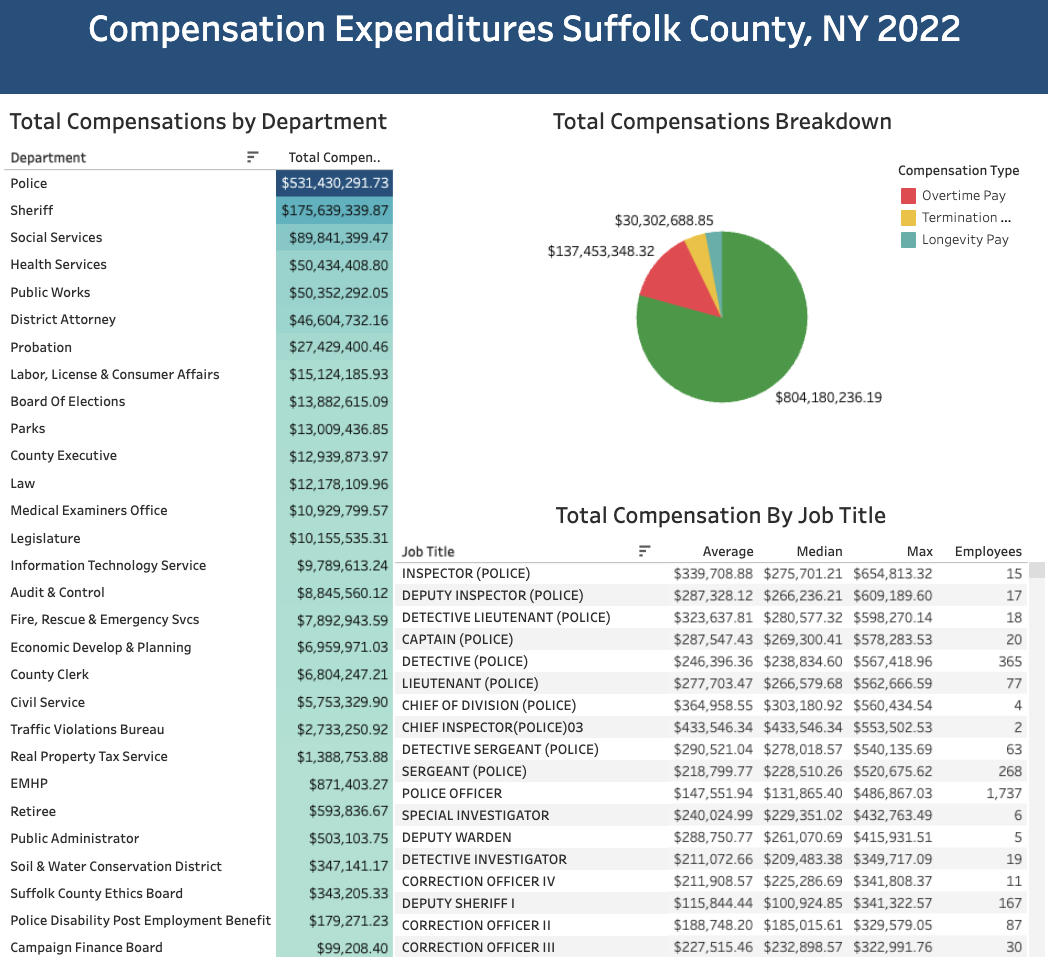
Suffolk Salaries Analysis
This project visualizes salary expenditures in Suffolk County, NY through an interactive Tableau dashboard. Publicly available payroll data was cleaned and preprocessed in Python to remove sensitive information, streamline job titles, and enhance clarity. The analysis revealed that over 25% of total compensation went to the police department, which received more funding than all other departments combined. Notably, the highest-paid public employee in 2022 was a police inspector who earned approximately $654,000,an amount likely driven not just by salary, but also by retirement payouts and other lump-sum compensation.
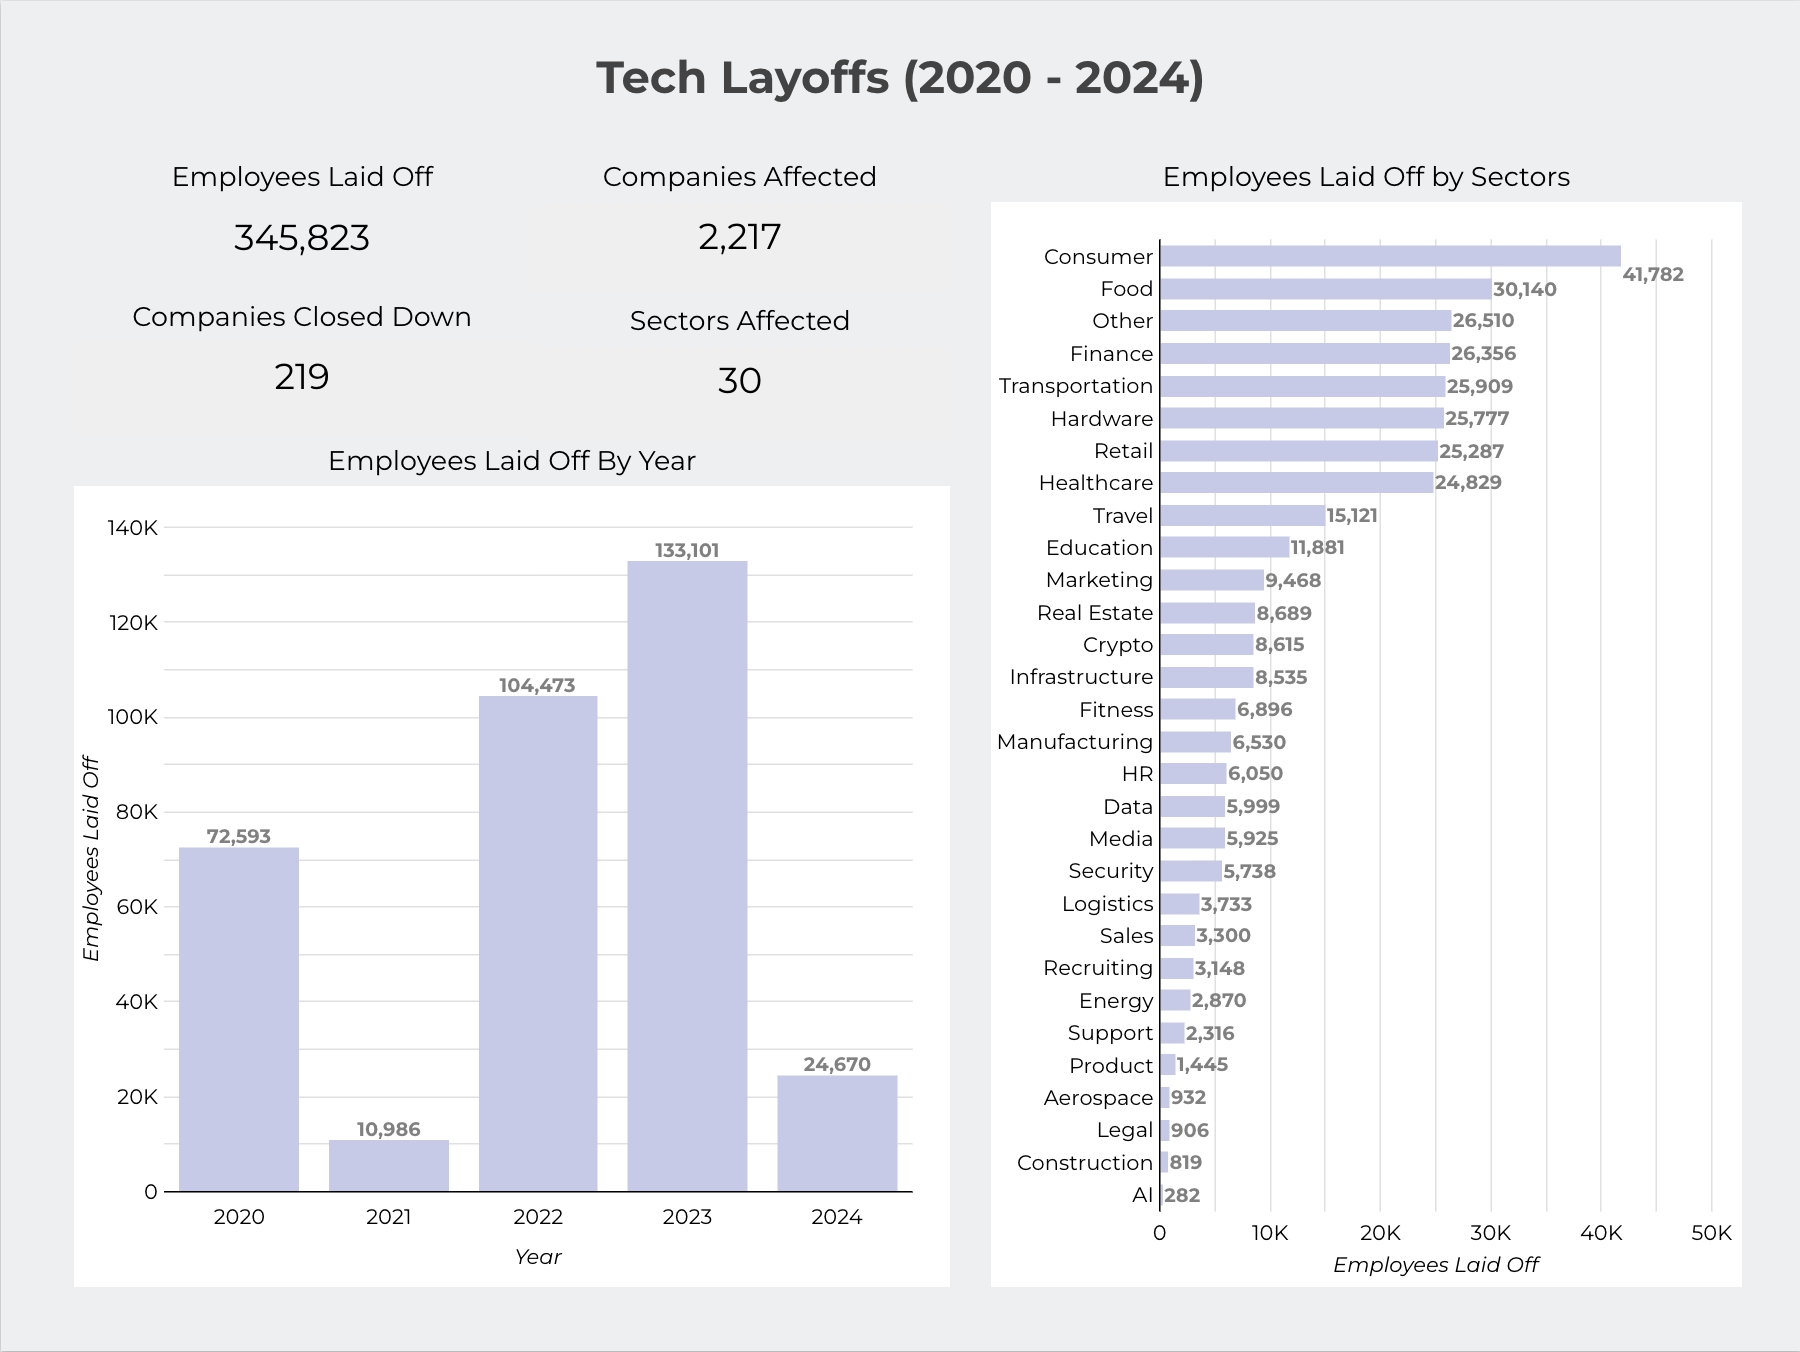
Tech Layoffs Analysis
This end-to-end project tracks recent tech industry layoffs and presents insights through a multi-page interactive report built in Looker. Data was sourced as a CSV file, uploaded to an AWS RDS MySQL database, and cleaned using SQL to handle duplicates, naming inconsistencies, and null values. After processing in a staging table, the refined data was moved to a final table and visualized in Looker. The report includes an overview of layoff trends, company-specific breakdowns, and geographic impact. Note: As of 10/23/2024, the AWS RDS instance is no longer live; however, screenshots of the dashboard are available on GitHub.
Get in Touch
mdonnoban@gmail.com